
Figure 4.
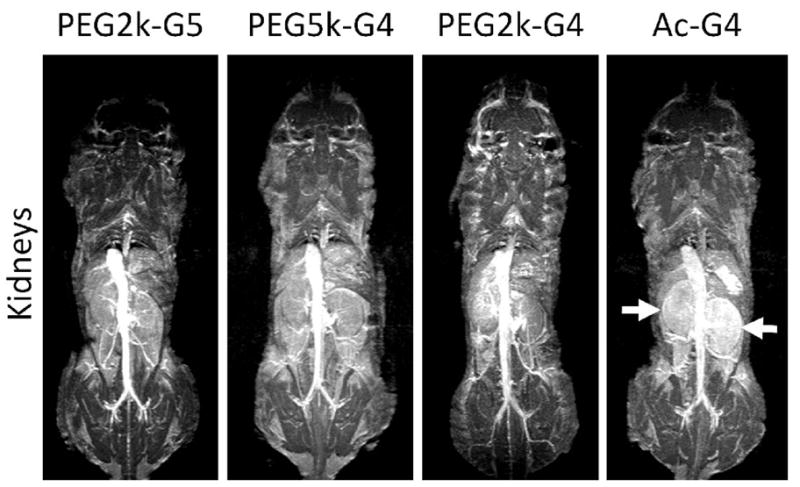
3D MR images of the heart and large vessels (top) and kidneys (bottom) of mice injected with (A) PEG2k-PAMAM (G5), (B) PEG5k-PAMAM (G4), (C) PEG2k-PAMAM (G4) and (D) Ac-PAMAM (G4) at 1h after injection. Only Ac-PAMAM (G4) shows decreasing intensity from the heart and vessels and enhancement in the kidney parenchyma (arrows).