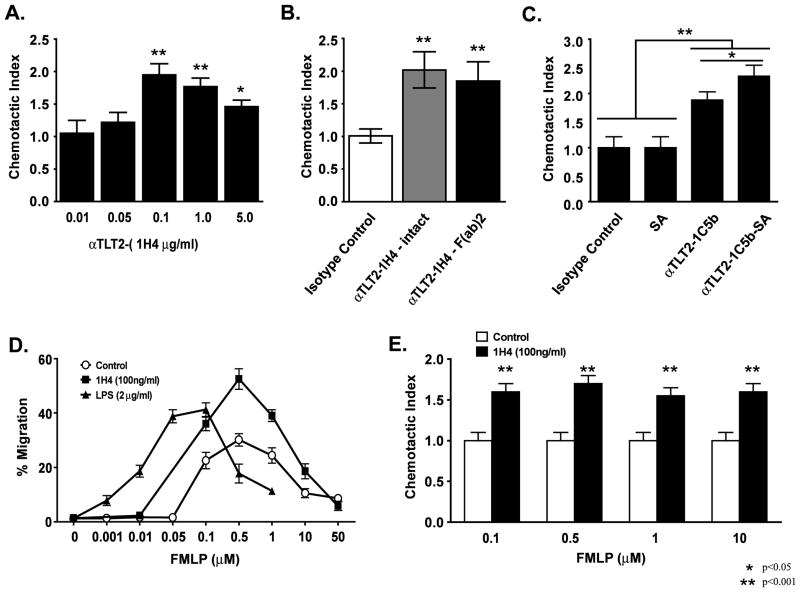
Figure 2. TLT2 ligation enhances the chemotactic response of neutrophils to FMLP.
Purified neutrophils (1×10⁶) were placed in the upper chamber of a 3 μm transwell device in the presence or absence of the indicated concentration of the αTLT2 mAb 1H4 (A) or 100 μg of either intact or F(ab′)2 fragments of 1H4 (B) or 1 μg of the αTLT2 mAb 1C5 coupled to biotin with or without streptavidin (20 μg) (C). For panels B and C, isotype control indicates samples in which 0.1 or 1 μg/ml of rat mAb was added to the upper chamber, respectively. For panels (A–C) 1 μM FMLP was added to the lower chamber for all samples. After 1 h, the cells were harvested from the lower chamber and counted. The number of cells present in the lower chamber for each experimental condition was divided by the number of migrating cells in control samples (FMLP alone) to determine the chemotactic index. The mean ± SD is shown for triplicate samples and the experiments depicted are representative of at least 3 independent experiments. (D) TLT2 ligation enhances neutrophil migration in response to a wide range of FMLP concentrations. Neutrophils (1×10⁶) in medium alone, or containing 100 ng/ml of 1H4 mAb or 2 μg/ml LPS were placed in the upper chambers of transwell devices. The indicated concentrations of FMLP or medium alone were placed in the lower chambers. The percentage of cells migrating into the lower chamber are the average of triplicate samples with the mean ± SD shown, and are representative of at least three independent experiments. (E) TLT2 potentiation of FMLP-mediated chemotaxis is proportional across a wide dose response. The chemotactic indices for αTLT2 mAb pretreated versus control neutrophils in response to FMLP are depicted. The values are derived by dividing the % migration data for αTLT2 pretreated samples by the % migration for neutrophils incubated in medium alone as shown in (D). Asterisks denote significance of values for αTLT2 mAb-treated samples compared to the respective control sample.

