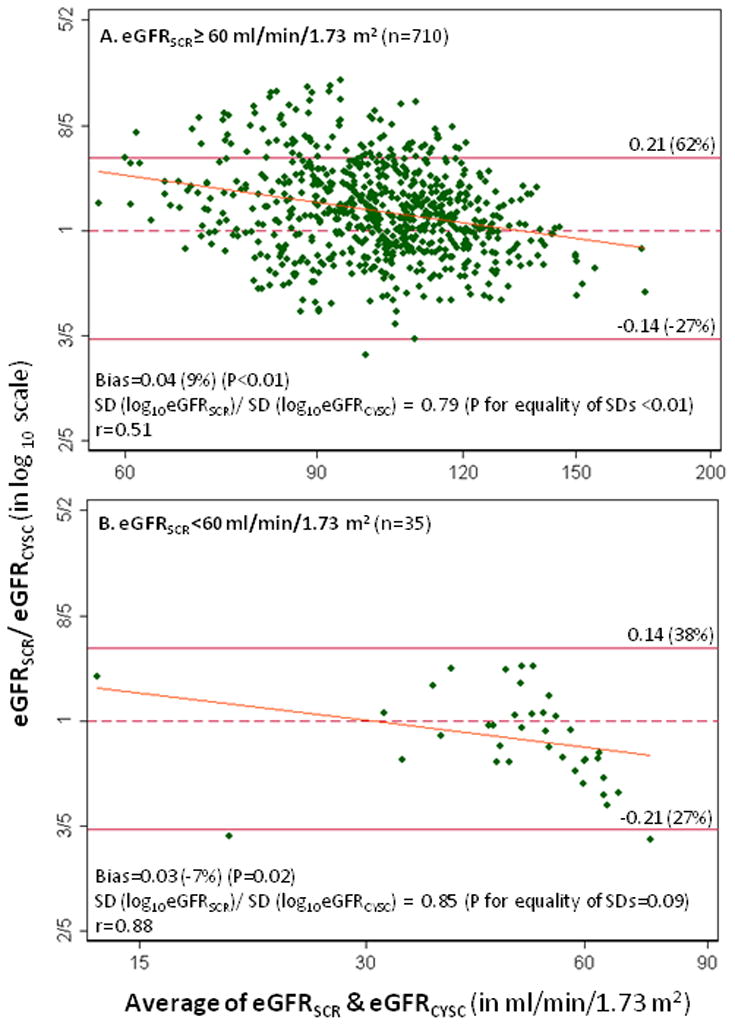
Figure 1.

Bland-Altman plots of the average vs. the difference between log10-transformed eGFRSCR and eGFRCYSC among HIV-infected men with eGFRSCR≥60 (A) and eGFRSCR<60 mL/min/1.73 m2 (B). The diagonal lines are the slope of the linear regression of the difference on the mean of eGFRSCR and eGFRCYSC. Thirty-six and two influential points were excluded in Panels A and B, respectively.
