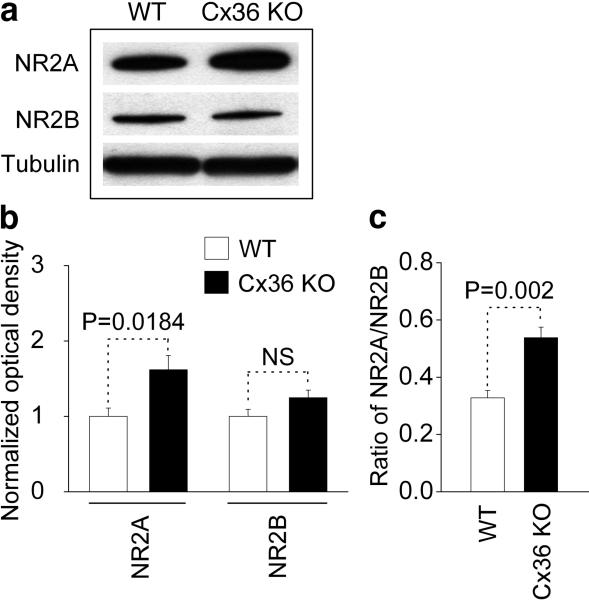
Fig.2.
The NR2A/NR2B ratio is higher in the hippocampus of Cx36 knockout mice than in WT mice. Data from western blot experiments are shown. a,b, Representative image (a) and statistical analysis (b) of the expression of NR2A and NR2B receptor subunits are shown. (c) Graph presents the analysis of the NR2A/NR2B ratio. Statistical analysis: paired (b) and unpaired (c) Students t-test; n = 6-7; mean ± SE. Optical density signals are normalized relative to tubulin. The westerns were done sequentially on one membrane.

