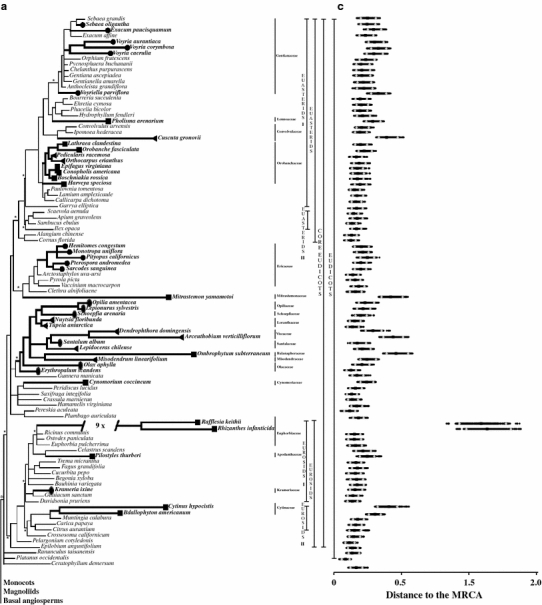
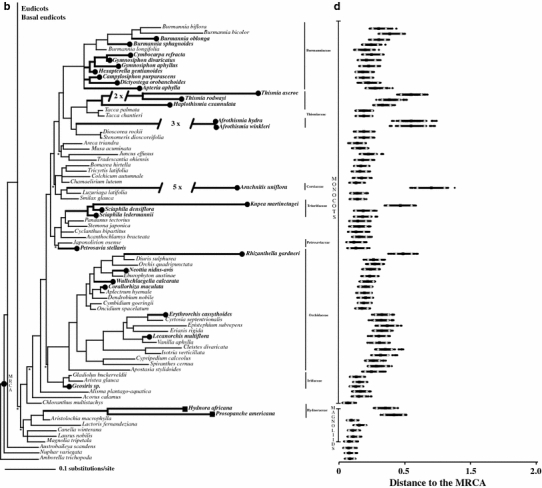
Fig. 1.


a, b The majority-rule consensus phylogram of the Bayesian analysis of the 18S rDNA data under topology constraints. The implemented constrains are indicated with asterisks. Branches in bold with a circle, a square, a diamond and an ellipse are, respectively, mycoheterotrophic, holoparasitic, hemiparasitic and facultative hemiparasitic lineages. c, d The Bayesian relative rates test shows the relative branch lengths of all ingroup taxa using Amborella as most recent common ancestor (MRCA). The squares indicate the mean branch lengths. The triangles delimit the 95% confidence intervals
