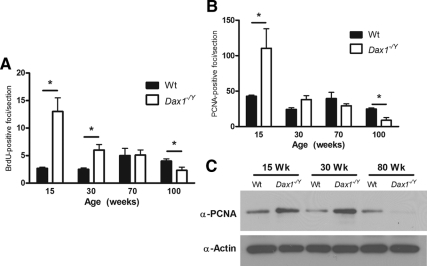
Fig. 5.
Quantification of proliferation markers in Wt and Dax1−/Y mice. BrdU- (A) and PCNA-positive (B) foci per adrenal section were quantified. For each age, foci were counted in three adrenal sections for each animal and results presented as average ± se. Wt are represented by black bars, and Dax1−/Y are represented by white bars; *, P < 0.05, n = 5. C, Protein was isolated from freshly harvested adrenals and subjected to immunoblot analysis for PCNA and β-actin.

