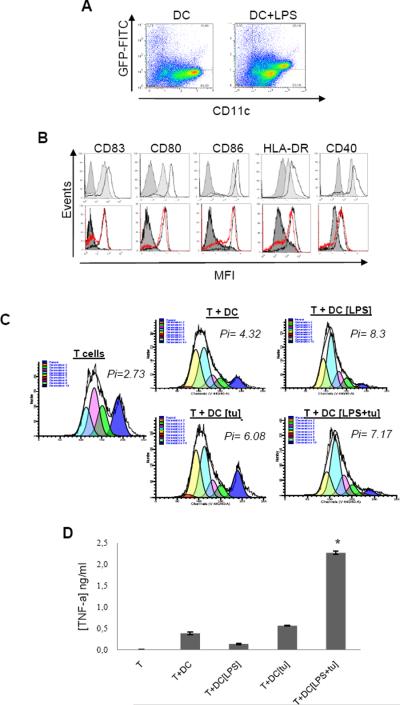
Figure 4. hKDC exhibit the phenotypical and functional characteristics of mature activated APC after killing of tumor cells.
A: GFP transfected HT29 tumor cells were cultured with day 5 monocyte-derived DC (DC) or with LPS (DC+LPS) for 72 h. The cells were then stained with CD1a Ab and analysed by flow cytometry for GFP expression. Representative data of three experiments performed with DC from healthy donors. B: Upper histograms: Phenotype of day 5 monocyte-derived DC (dark gray) compared with mature DC (light gray) or hKDC from healthy patient (black line); Lower histograms: Phenotype of day 5 monocyte-derived DC (full gray) compared with hKDC from healthy patient (black line) or from cancer patients (red line). hKDC were collected from a 48 h-culture with HT29 tumor cells and LPS. Cells were stained with the indicated Ab and analysed by flow cytometry. C: Autologous T lymphocyte proliferation was assessed using Cell Trace Violet cell proliferation kit as described in material and methods. Cell Trace Violet labelled purified T cells were co-cultured with day 5 immature DC without activator (T+DC), with LPS (100 ng/ml) (T+DC+LPS), with HT29 tumor cells (T+DC+[tu]) or with HT29 tumor cells in the presence of LPS (T+DC [LPS+tu]) (DC:T ratio = 1:10). Non-activated T cells were used as a negative control and T cells stimulated with anti-CD3/anti-CD28 T cell expansion beads were used as a positive control (T cells). The T cell proliferation index (Pi) was defined after 5 days of T cell/DC co-cultures using ModFit software. 4B, 4C: Representative results from 3 experiments performed with DC from 3 different healthy donors and from 3 different cancer patients. D: Immature day 5 DC were cultured with T1 melanoma cell line in the presence or absence of LPS (100 ng/ml). After 48 h DC were harvested from these co-cultures and plated with anti-T1 CD8+ T cells (CTL clone specific for Melan-A25–36 peptide) for an additional 4 h (DC:Tcell ratio = 5:1). TNF-α production by CTL was measured using a TNF-α ELISA kit.

