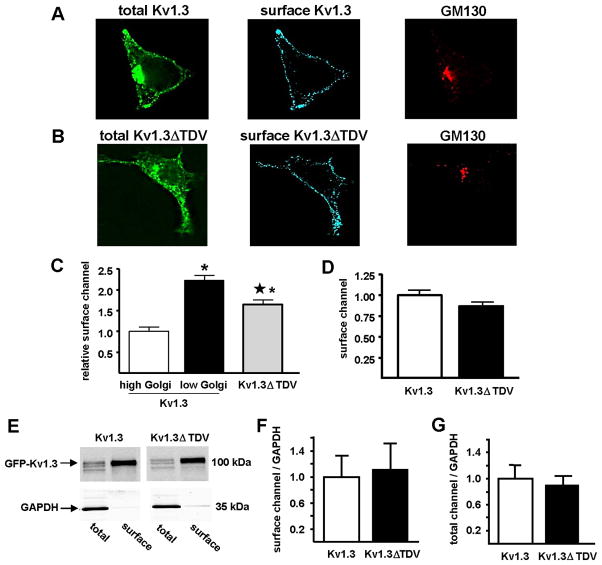
Fig. 5. Truncation of C-terminal PDZ binding domain does not affect surface expression of Kv1.3.
Representative photomicrographs of HEK293 cells transfected with Kv1.3 (A) or Kv1.3ΔTDV (B) (total Kv1.3; green) and live labeled with anti-FLAG-M2 (surface Kv1.3; blue) to detect the extracellular Kv1.3-FLAG epitope, and thus Kv1.3 at the cell surface. After fixation, cells were labeled with anti-GM130 (GM130; red) to define the Golgi region. C) Surface channel was measured immunohistochemically in cells transfected with Kv1.3 or Kv1.3ΔTDV and normalized to that measured in the high Golgi Kv1.3 cells (Kv1.3 high, white bar, n = 41; Kv1.3 low, black bar, n = 41; Kv1.3ΔTDV, gray bar, n = 59). * indicates statistically significant difference from Kv1.3 high Golgi and ★ indicates statistically significant difference from Kv1.3 low Golgi; p < 0.05; one way ANOVA). D) Surface channel was measured by flow cytometry in cells transfected with Kv1.3 or Kv1.3ΔTDV and normalized to surface Kv1.3. E) Surface and total channel protein were measured by cell surface biotinylation in cells transfected with Kv1.3 and Kv1.3ΔTDV. Total and surface Kv1.3 detection was done with anti-Kv1.3 monoclonal antibody (0.42 μg/mL; NeuroMab). A monoclonal anti-GAPDH antibody (1.0 μg/mL; Millipore) was used to control for loading efficiency. F) Immunoblots were quantified and surface expression (surface/GAPDH) of Kv1.3 and Kv1.3ΔTDV were normalized to Kv1.3 (n = 3). G) Total channel protein (total/GAPDH) of Kv1.3 and Kv1.3ΔTDV were normalized to Kv1.3 (n = 3).

