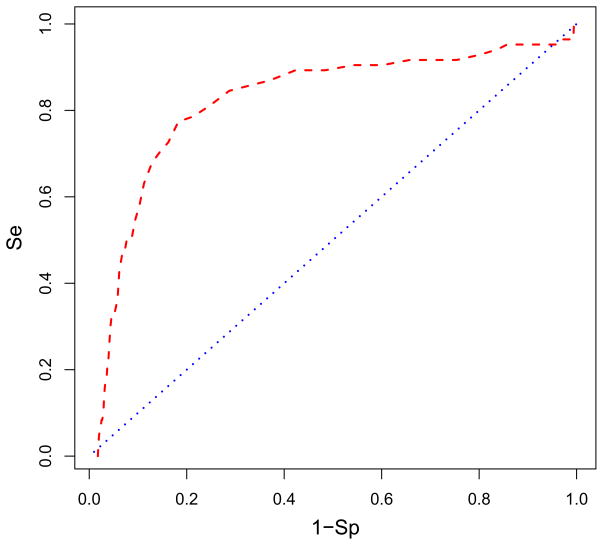
Figure 9.
The ROC curve in red is plotted showing what percentage of AnalytiCon active compounds is found in the ranked database of all compounds bound to site 500S with the DNA:RNA substrate present. The blue line indicates the ROC if the actives were randomly distributed in the database. Figure details can be found in the caption of Fig. 6. The enrichment is 58% of the actives found in the top 10% of the screened database. The area under the ROC curve is 0.815. Figure was generated with R.71

