
Figure 3.
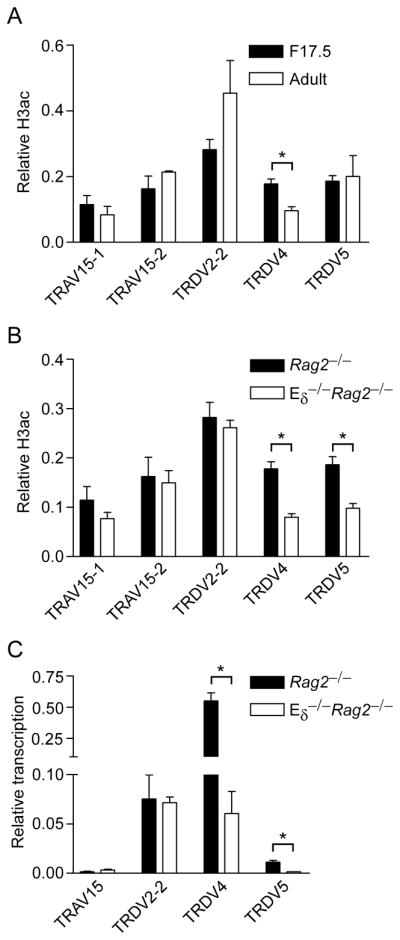
Influence of Eδ on Tcra/Tcrd locus histone acetylation and germline transcription in fetal thymocytes. H3ac was measured by ChIP using chromatin prepared from (A) F17.5 and adult Rag2−/− DN thymocytes and (B) F17.5 Rag2−/− and Eδ−/−Rag2−/− thymocytes. The data represent the mean ± SEM of three to five independent chromatin preparations for each genotype and developmental stage. Values of bound/input were expressed relative to B2m (normalized to one) in each sample. C. Germline transcription was measured by quantitative real-time PCR using cDNA prepared from F17.5 Rag2−/− and Eδ−/−Rag2−/− thymocytes. The data represent the mean ± SEM of two independent cDNA preparations for each genotype, all normalized to values for Actb. *, P<.05 by two-tailed Student’s t-test.