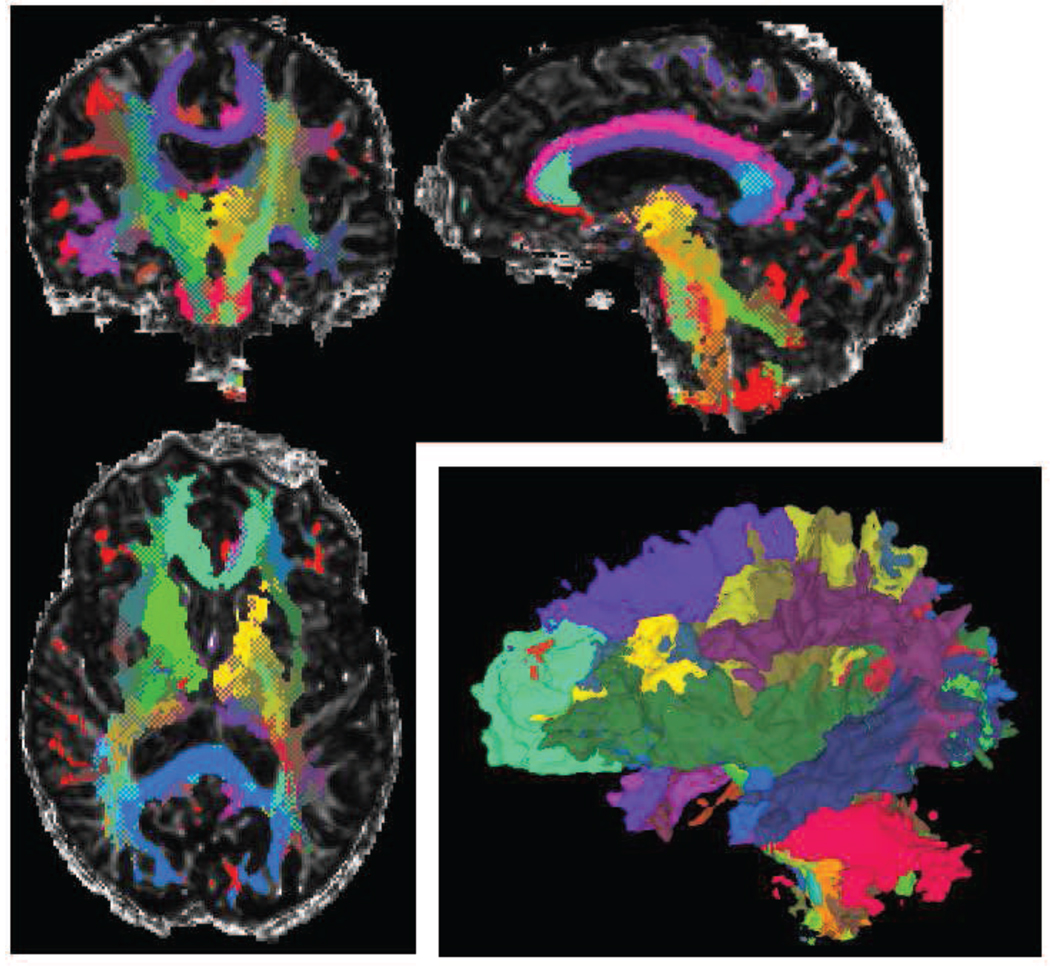
Figure 3.
DOTS segmentation example for one subject of our reproducibility study in axial, coronal, sagittal views and 3D rendering. Regions of overlapping tracts are displayed as a checkerboard pattern of the tracts’ colors in the 2D views. It is notable that many regions of overlap are found in practice. The recovered tracts boundaries are also somewhat irregular, as such boundaries are poorly defined on the tensor images.

