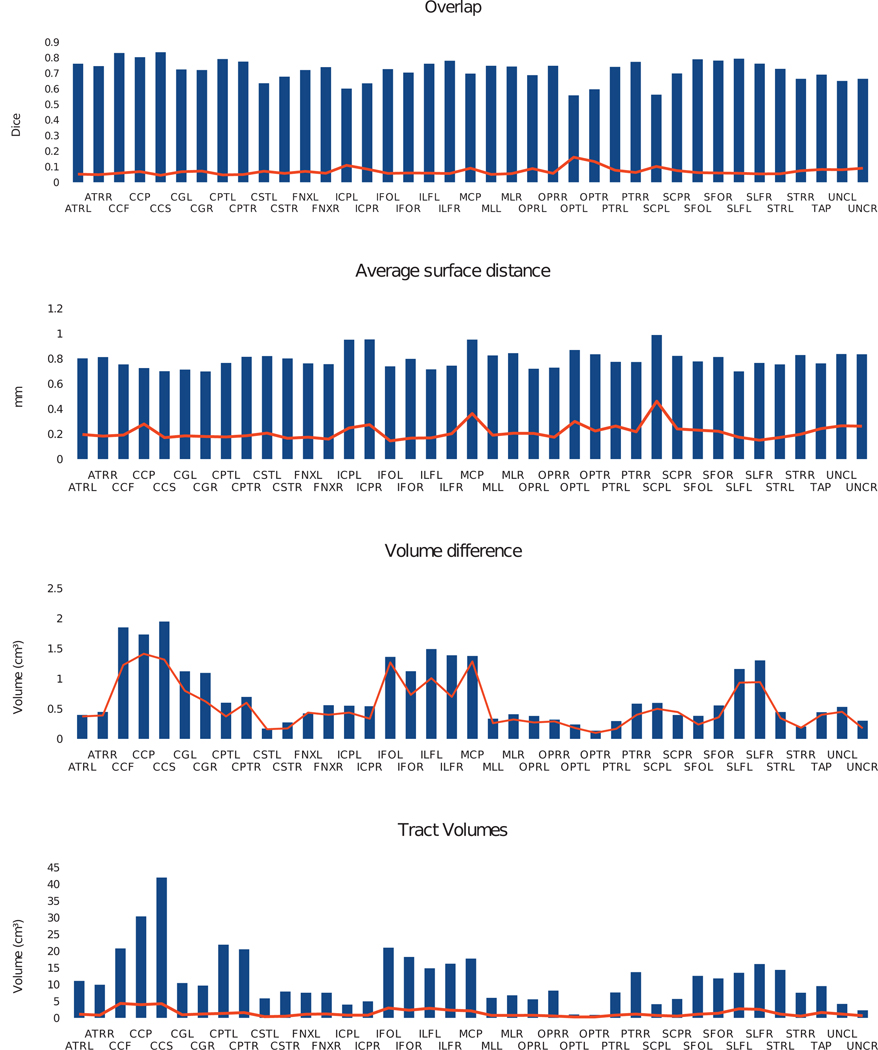
Figure 5.
DOTS segmentation results for two successive acquisitions. Mean (bar) and standard deviation (line) for 21 subjects of the following measures (from top to bottom): Dice overlap, average boundary surface distance, volume difference (as a percentage of the average volume), and average volume.

