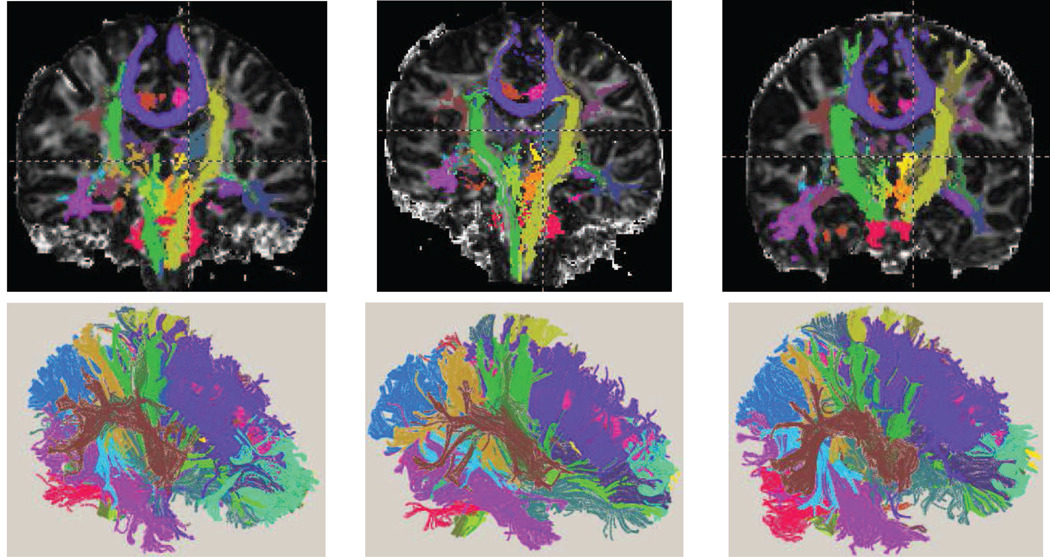
Figure 7.
Tractography results automatically labeled with DOTS for the three subjects of Fig. 6 in coronal view and 3D rendering. The bundles are overall rather homogeneous, and the included regions are similar in size to the original DOTS labels, indicating that the reconstructed fibers follow quite closely the DOTS segmentation.

