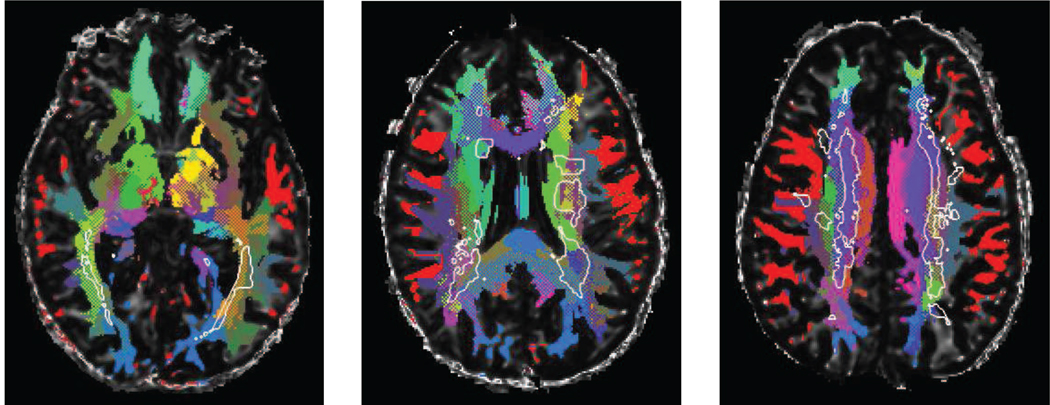
Figure 8.
DOTS segmentation examples for three different subjects with multiple sclerosis. The white matter lesions segmented from the co-registered structural images (T1 and FLAIR) are indicated with a white outline. Although the lesions do not follow given tracts, it is clear that certain tracts are largely spared while others are strongly affected.

