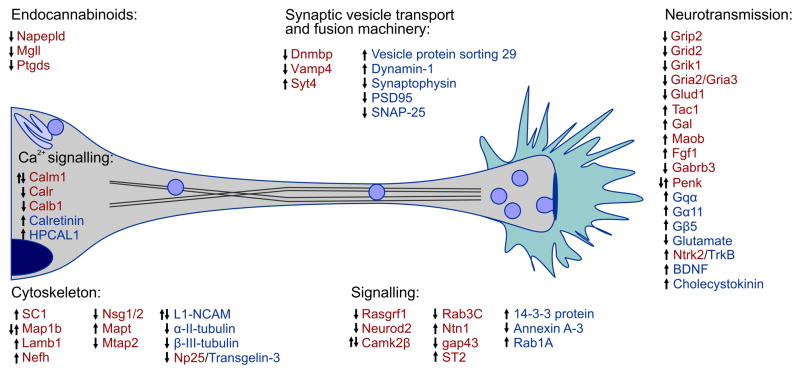
Figure 4. Molecular blueprint of CB1R activation by THC or synthetic agonists in relation to axonal growth and synapse development, deduced from genome and proteome-wide arrays.
Red and blue colors indicate molecular entities identified through genomic [21,22,85–87,89,98–100] and proteomic approaches [14,16,87,88,90,91], respectively. Corresponding gene and protein clusters are indicated. Arrows indicate the direction of regulation upon drug exposure. Double arrows suggest divergent responses due to experimental conditions [21,22], age [89,99], sexual dimorphism [100] or length [89,98] of treatment.

