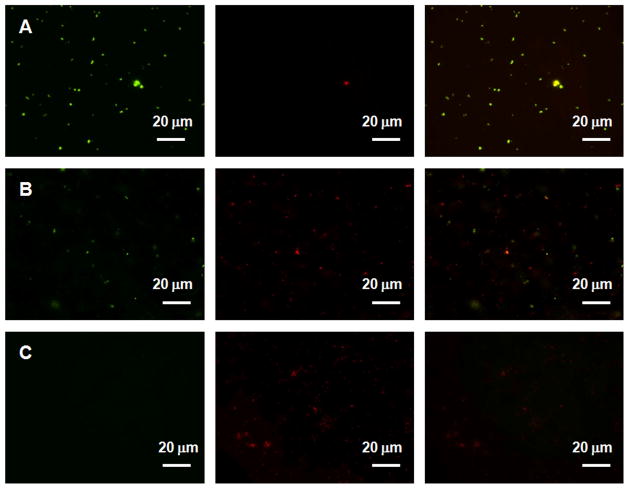
Fig. 10.
Representative fluorescent micrographs showing comparison of surfaces of A) bare glass B) (e-PEI/Alg)50 C) (PEI/Alg)50 after soaking in 105 CFU/mL E coli containing 50 μM GSH for 2h at 37.5 °C. Bacterial cells were stained with Bacterial LIVE/DEAD staining dyes and viable cells shown green while dead or membrane damaged cells shown red fluorescence in the images.

