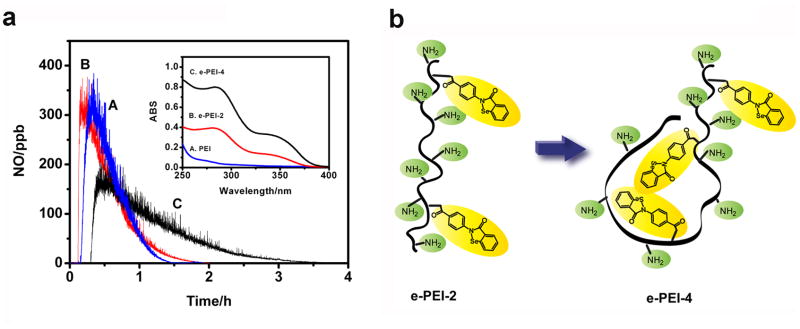
Fig. 3.
a) Catalytic NO generation profiles indicating comparison of RSNO decomposition catalytic activity of A) C-ebselen, B) e-PEI-2 C) e-PEI-4 in solution with 100 μM EDTA, 50 μM selenolate and 50 μM GSNO, insert shows the UV-Vis spectra of same concentration (67 μg/mL) of A) PEI, B) e-PEI-2, C) e-PEI-4 in PBS buffer b) schematic illustration of possibility of formation of hydrophobic centers in e-PEI-4 that prevent access of GSH and GSNO to the catalytic sites.

