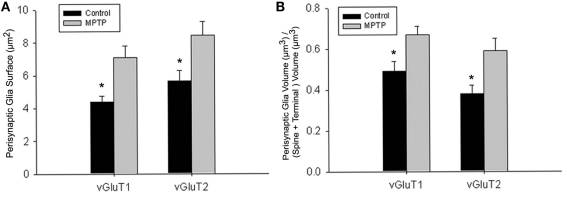
Figure 6.
Quantitative analysis of the perisynaptic glia from tripartite synapses (TS) in control and MPTP-treated animals (mean ± SEM). (A) Histograms comparing the surface area of perisynaptic glia associated with vGluT1- and vGluT2-immunopositive axo-spinous synapses in control (N = 3) and MPTP-treated (N = 3) monkeys. The surface of the perisynaptic glia was significantly larger (*t-test, P = 0.017 for vGluT1 and P = 0.006 for vGluT2) in MPTP-parkinsonian monkeys than in control. (B) Histograms comparing the ratio of the volume of the perisynaptic glia over the total volume of the spine and the axon terminals in TS formed by vGluT1- or vGluT2-immunoreactive terminals. This ratio was significantly larger in MPTP than in control condition (*t-test, P = 0.049 for vGluT1 and P = 0.028 for vGluT2). No significant difference was found between TS formed by vGluT1- or vGluT2-immunoreactive terminals. Total number of reconstructed spines = 32, 8 per group. Statistics were performed by using SigmaPlot (version 11.0).

