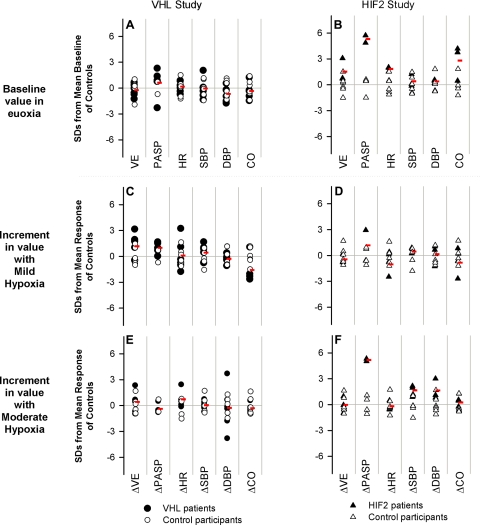
Figure 1.
Cardiopulmonary variables in both the VHL and HIF2 studies: baseline measurements (A, B) and incremental responses with mild hypoxia (C, D) and moderate hypoxia (E, F). Results are shown in terms of number of (control group) sd by which each participant's baseline and response differed from the mean baseline and mean response, respectively, of the control participants. Red symbols show average results for patient groups. A, C, E) VHL patients were not significantly different from the control participants for any variable. B, D, F) Under baseline conditions, HIF2 patients had significantly higher pulmonary arterial pressure, heart rate, and cardiac output than control participants. Compared with control participants, HIF2 patients also had a significantly greater rise in pulmonary arterial pressure with moderate hypoxia. VE, ventilation; PASP, pulmonary arterial systolic pressure; HR, heart rate; SBP, systolic blood pressure; DBP, diastolic blood pressure; CO, cardiac output; Δ, increment.

