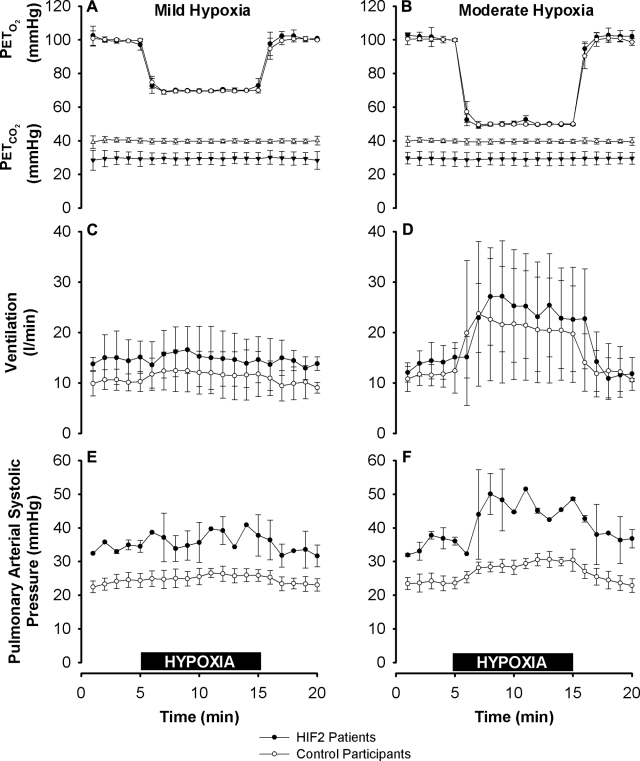
Figure 2.
End-tidal gas control, ventilation, and pulmonary arterial systolic pressure during mild and moderate hypoxia. A, B) PETo2 and PETco2 in mild hypoxia (A) and moderate hypoxia (B). PETo2 was well matched between groups. PETco2 was lower for the HIF2 patients, reflecting their lower baseline air-breathing PETco2. C, D) Ventilation, given at body temperature and pressure, saturated with water vapor, in mild (C) and moderate hypoxia (D). Baseline ventilation and the increase in ventilation provoked by hypoxia were not significantly different between the two groups. E, F) Pulmonary arterial systolic pressure. Compared with control participants, HIF2 patients had elevated pulmonary arterial systolic pressures at baseline (24±2 vs. 35±1 mmHg, P<0.003), and increased sensitivity to moderate (F) but not mild (E) hypoxia (5.5±1.3 vs. 11.5±0.7 mmHg, P<0.004). Values are expressed as means ± sd. Horizontal black bars indicate 10-min periods of mild (A, C, E) and moderate (B, D, F) exposures to hypoxia.

