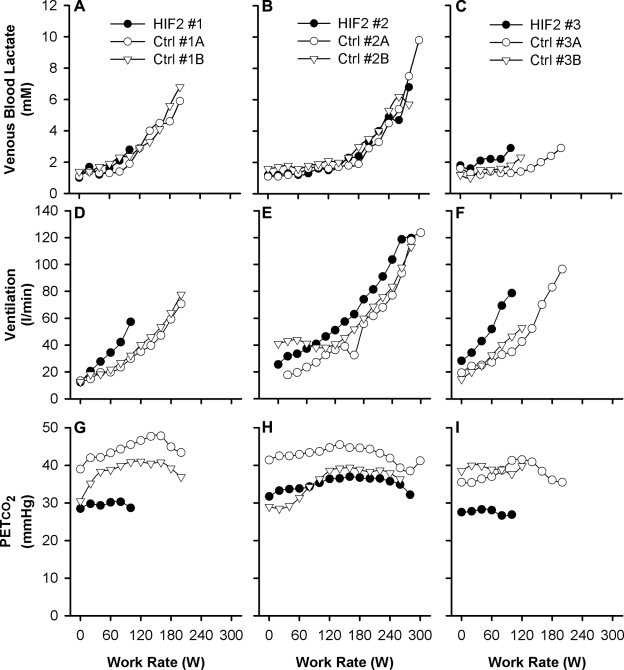
Figure 4.
Individual responses for HIF2 patients and control participants during the incremental exercise test to exhaustion. A–C) Venous blood lactate concentration as a function of work rate. D–F) Ventilation as a function of work rate. G–I) PETco2 as a function of work rate. Results are for HIF2 patient 1 (A, D, G), HIF2 patient 2 (B, E, H), and HIF2 patient 3 (C, F, I) and their associated control participants. Data are minute averages.

