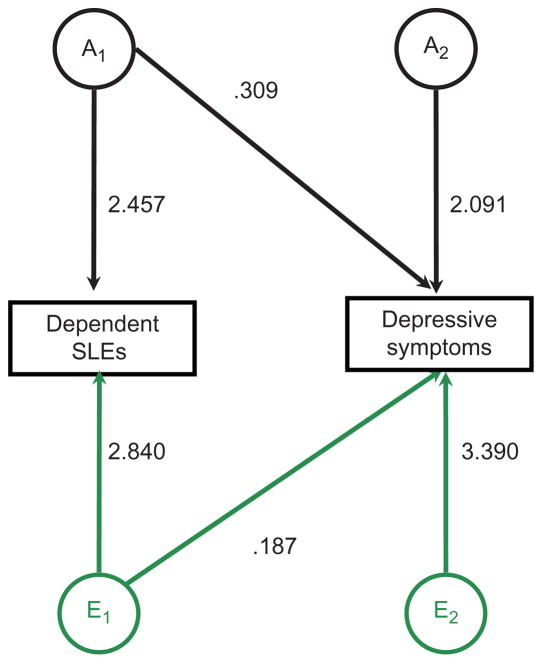
Figure 2.
Path coefficients from the best-fitting (AE) bivariate model. (color figure available online) Note: All data come from Waves I-III of the National Longitudinal Study of Adolescent Health. Parameter estimates were obtained using Mx statistical software (Neale et al. 2003) and denote the paths for the best-fitting model described in Table 2. Saturated model −2LL = 11910.32, reduced model (dropping C) −2LL = 11912.89, χ2 = 2.571, df = 3, p < .463.

