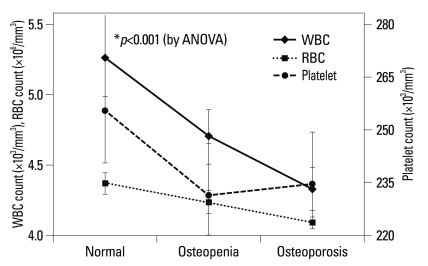
Fig. 2.
Blood cell counts according to three subject groups by BMD (i.e., normal, osteopenia and osteoporosis). As BMD decreases blood cell counts also gradually decrease. *all three p-values for white blood cell, red blood cell and platelet counts are <0.001, estimated by one-way analysis of variances (ANOVA). BMD, bone mineral density; WBC, white blood cell; RBC, red blood cell.

