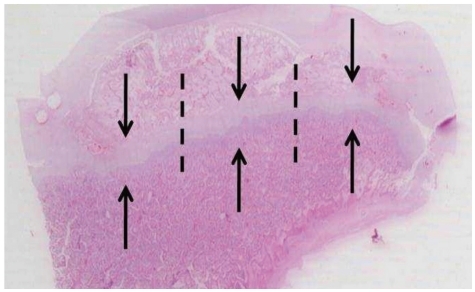
Fig. 4.
After staining with hematoxylin and eosin, the thickness of the growth plates was measured. The growth plate was divided into three regions on coronal sections (medial, middle, and lateral thirds, and dot lines show borders of each region) and the thicknesses were measured along the direction of enchondral ossification (axis of arrows) at each region and averaged.

