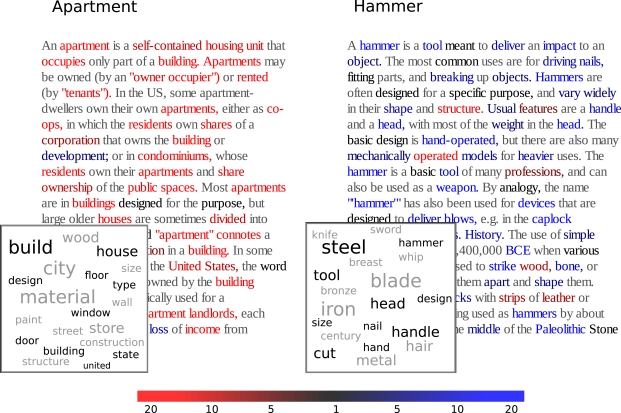
Figure 3.
The inset under each article shows the top words from the corresponding brain-derived distribution [10 which are present in the article (black) and 10 which are not (gray)]. Each word of the two articles is colored to reflect the ratio papartment (word)/phammer(word) between the probabilities assigned to it by the brain-derived distributions for concepts “apartment” and “hammer” (red means higher probability under “apartment,” blue under “hammer,” gray means the word is not considered by the text model).

