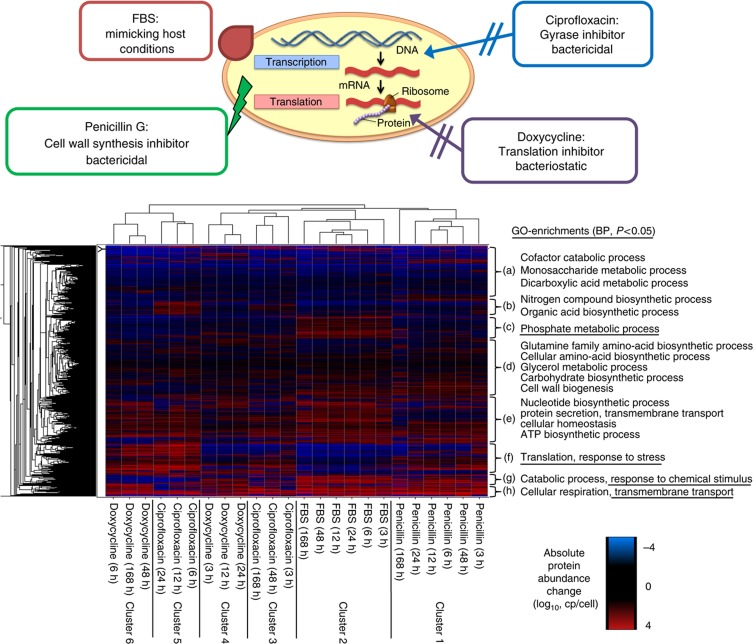
Figure 3.
Hierarchical clustering of protein concentration changes. Hierarchical clustering of absolute protein abundance changes to the corresponding untreated control samples in copies/cell (log10) for all 24 treatments. The column dendrogram representing the clustering of the differentially perturbed samples is displayed and the clusters (1–6) obtained are indicated. Significantly enriched (P<0.05) biological processes (BP) based on GO are indicated for all eight protein clusters obtained (a–h).

