Figure 1.
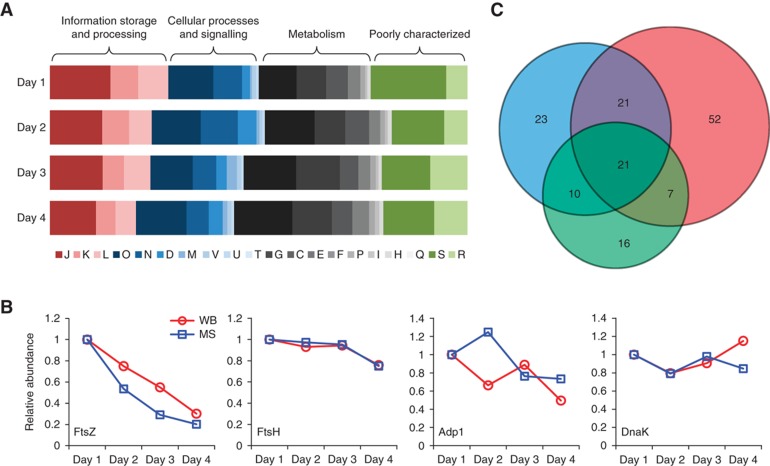
Proteome composition changes in response to cellular perturbations. (A) COG class dynamics over the course of 4 days growth in batch culture. Functional classes are colour coded. See Supplementary information for COG class nomenclature. (B) Abundance changes of proteins along the growth curve. Blue (MS): mass spectrometry data; red (WB): quantified western blots. (C) Venn diagram for proteins with significantly changed abundance in response to cellular perturbations. Red: heat shock; blue: DNA damage; green: osmotic stress.

