Figure 2.
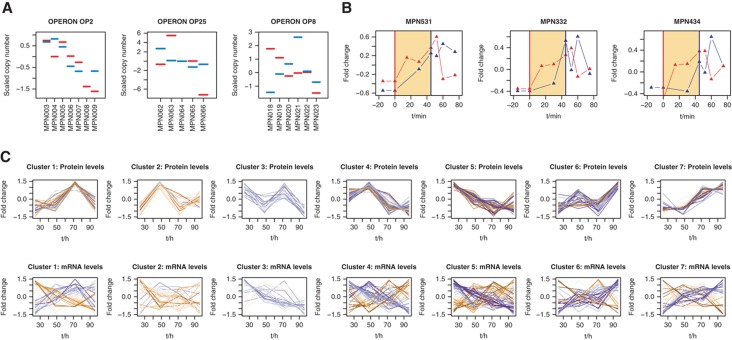
mRNA and protein profiles indicate complex post-transcriptional regulatory mechanisms. (A) Examples for abundance dynamics for mRNA and proteins in operons. Red: mRNA; blue: protein. See Supplementary information for additional profiles. (B) Heat-shock response on mRNA and protein levels for ClpB (MPN531), Lon (MPN332) and DnaK (MPN434). Red vertical line: heat shock start; blue vertical line: heat shock end. Red triangles: mRNA; blue triangles: protein. (C) mRNA and protein dynamics along the growth curve. Blue colour: similar patterns of abundance change; orange colour: different patterns of abundance change.

