
Figure 1.
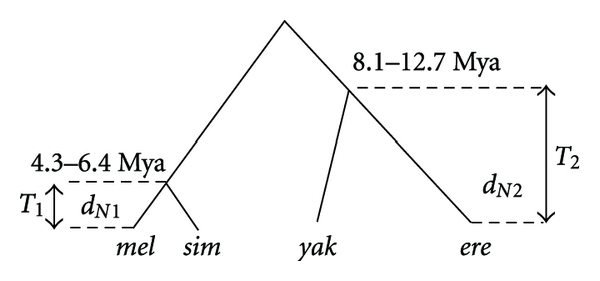
Schematic representation of rational implemented in our methodology. d N1: proportion of nonsynonymous substitutions in the more recently diverged species pair (diverged for time T 1). d N2: proportion of nonsynonymous substitutions in species that have diverged for longer periods of time (T 2).