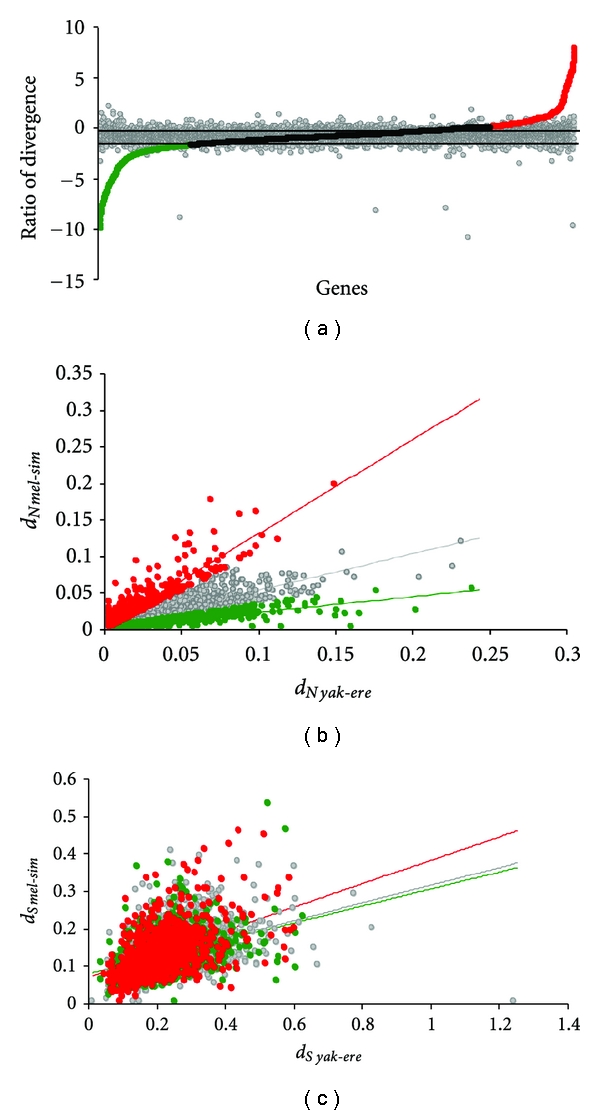
Figure 2.

Distribution of ratio of divergence between D. melanogaster-D. simulans versus D. yakuba-D. erecta. (a) Distribution of molecular-divergence log2 (d N1/d N2) to divergence-time ratio log2 (T 1/T 2), between D. melanogaster-D. simulans and D. yakuba-D. erecta. Colored circles represent d N ratios, and gray circles represent d S ratios. The upper limit of the clockwise category is given by the log2 ratio of divergence times (6.5/8.1) and the lower limit by the log2 ratio 4.3/12.7. (b) Relationship of d N between D. melanogaster-D. simulans and D. yakuba-D. erecta. The regression lines for each rate categories are also plotted. (c) Relationship of d S between D. melanogaster-D. simulans versus D. yakuba-D. erecta; color codes: red: accelerated, black: clock-like, green: slow-rate categories, and grey: d S ratios.
