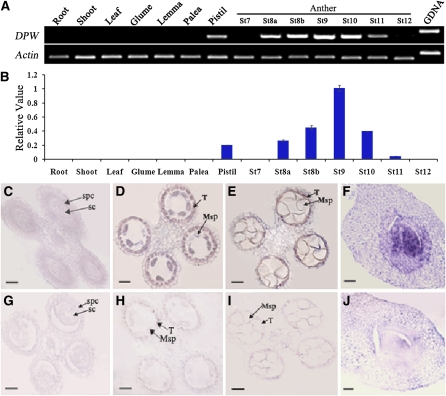
Figure 7.
DPW Expression Pattern.
(A) Spatial and temporal expression analysis of DPW by RT-PCR. Each reaction had three biological repeats. Actin1 served as a control.
(B) qRT-PCR analysis of DPW. St8a, stage 8a; St8b, stage 8b; St9, stage 9; St10, stage 10; St11, stage 11; St12, stage 12. Error bars indicate sd, and each reaction had three biological repeats.
(C) to (J) In situ analyses of DPW in wild-type anthers and pistil.
(C) An anther at stage 7 showing no DPW expression.
(D) An anther at stage 8a showing DPW expression in tapetal cells and microspores.
(E) An anther at stage 10 showing reduced DPW expression in the tapetum and microspores.
(F) A pistil showing DPW expression.
(G) An anther at early stage 8 hybridized with the DPW sense probe.
(H) An anther at stage 8a hybridized with the DPW sense probe.
(I) An anther at stage 10 with the DPW sense probe.
(J) A pistil hybridized with the DPW sense probe.
Msp, microspore; SC, sporogenous cell; SPC, secondary parietal cell; T, tapetum. Bars = 25 μm.

