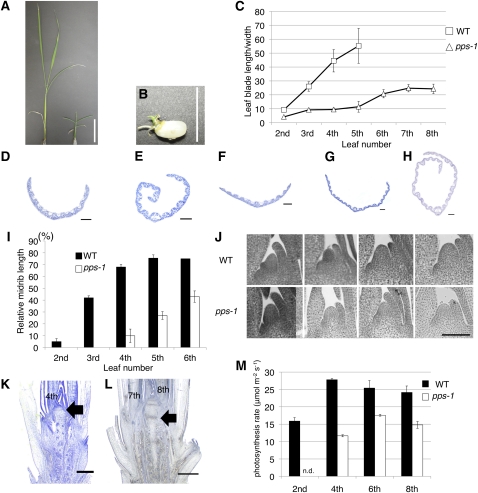
Figure 1.
Phenotypes of pps-1 Plants.
(A) Seedlings of 1-week-old wild type (left) and 1-week-old pps-1 (right).
(B) A rare germinated pps-2 seed.
(C) Comparison of the ratio of leaf blade length to width in the wild type (WT) versus pps-1.
(D) to (H) Cross sections of leaf blades.
(D) Cross section of wild-type second leaf blade cut at 10% of the distance from the base to the tip.
(E) Cross section of wild-type third leaf blade cut at 45% from the base.
(F) Cross section of pps-1 fourth leaf blade cut at 10% from the base.
(G) Cross section of pps-1 fifth leaf blade cut at 30% from the base.
(H) Cross section of pps-1 sixth leaf blade cut at 40% from the base.
(I) Comparison of relative midrib length in lead blades during development in the wild type versus pps-1. Midrib length is shown as a percentage of total blade length.
(J) Wild-type and pps-1 shoot apices showing temporal change of SAM size. From left to right, second leaf stage, third leaf stage, fourth leaf stage, and fifth leaf stage.
(K) Fourteen-day-old wild-type stem. Arrow indicates fourth leaf base node.
(L) Thirty-day-old pps-1 stem. Arrow indicates seventh leaf base node.
(M) Comparison of photosynthetic rates in the wild type and pps-1. Units = μmol CO2 m−2 s−1.
Data represent mean ± sd in (C) and (I) (n = 5) and in (M) (n = 3). Bars = 1 cm in (A), 5 cm in (B), 100 μm in (D) to (H), (K), and (L), and 50 μm in (J).
[See online article for color version of this figure.]

