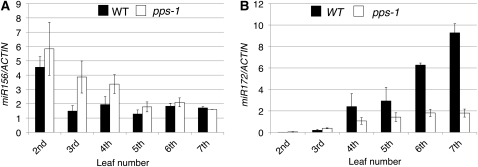
Figure 2.
Expression of Two miRNAs in Wild-Type and pps-1 Leaves.
(A) Expression of miR156 in the second to seventh leaf blades. WT, wild type.
(B) Expression of miR172 in the second to seventh leaf blades. Expression levels are represented relative to ACTIN expression. Each value is the average of three independent real-time PCR assays.
Data in (A) and (B) represent means ± sd (n = 3).

