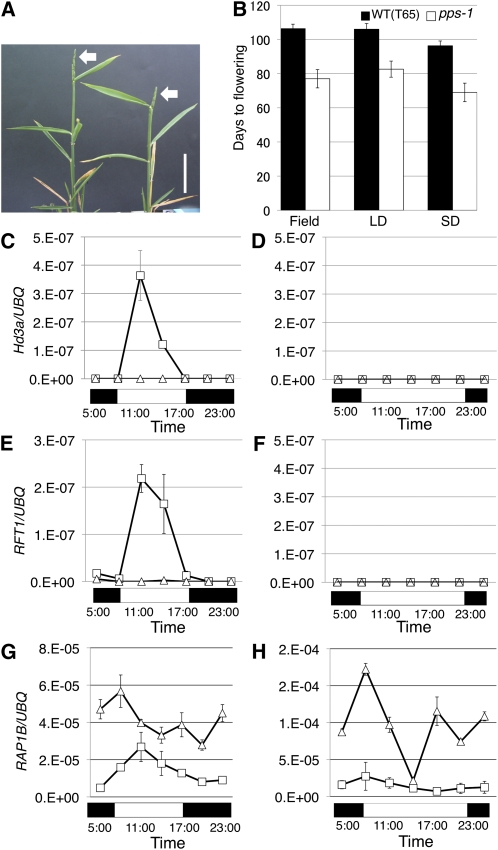
Figure 3.
Early Flowering Phenotypes in pps-1.
(A) Mature pps-1 plants. Arrows indicate panicles. Bar = 5 cm.
(B) Days to flowering in the wild type (WT) and pps-1 in field conditions, long day (LD) and short day (SD).
(C) Hd3a expression under short-day conditions.
(D) Hd3a expression under long-day conditions.
(E) RFT1 expression under short-day conditions.
(F) RFT1 expression under long-day conditions.
(G) RAP1B expression under long-day conditions.
(H) RAP1B expression under short-day conditions.
(C) to (H) White squares, the wild type; white triangles, pps-1. Black and white boxes under each panel represent periods of darkness and light, respectively. Data represent mean ± sd in (B) (n = 5) and in (C) to (H) (n = 3).
[See online article for color version of this figure.]

