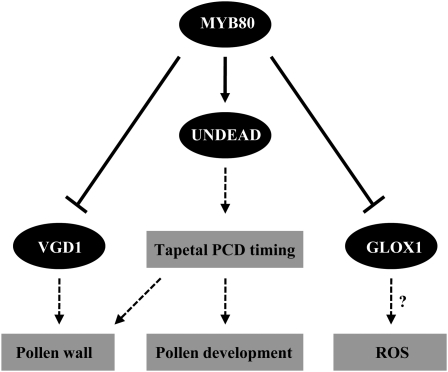
Figure 13.
A Proposed Model of MYB80 Function in Tapetal and Pollen Development.
Solid lines represent direct gene regulation (arrows represent positive regulation and closed arrows represent negative regulation, respectively). Dashed lines represent function. ?, Hypothesized function. For a comprehensive model, see Wilson and Zhang (2009) and Parish and Li (2010).

