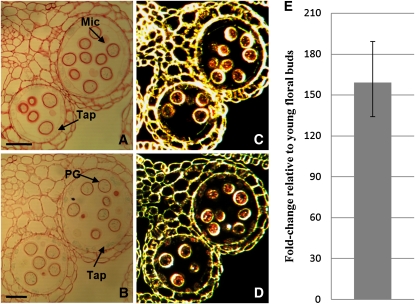
Figure 8.
VGD1 Expression Analysis.
(A) to (D) Sections (3 μm) of VGD1 promoter:GUS anthers stained with safranin. Light microscopy of anthers at stages 10 (A) and 11 (B). Blue crystals are weakly present within the tapetum and developing pollen grains. Dark-field microscopy of anthers at stages 10 (C) and 11 (D). GUS activity is visualized as red crystals. GUS activity was not detected in stage 8 or earlier stages.
(E) Comparative qRT-PCR analysis of VGD1 transcript levels in wild-type mature (anther stages 10 to 12) versus young (anther stages ≤ 9) floral buds. The VGD1 transcript level is higher in mature floral buds. Error bar represents sd. Mic, microspores; Tap, tapetum; PG, pollen grain. Bars = 25 μm.

