
Figure 2.
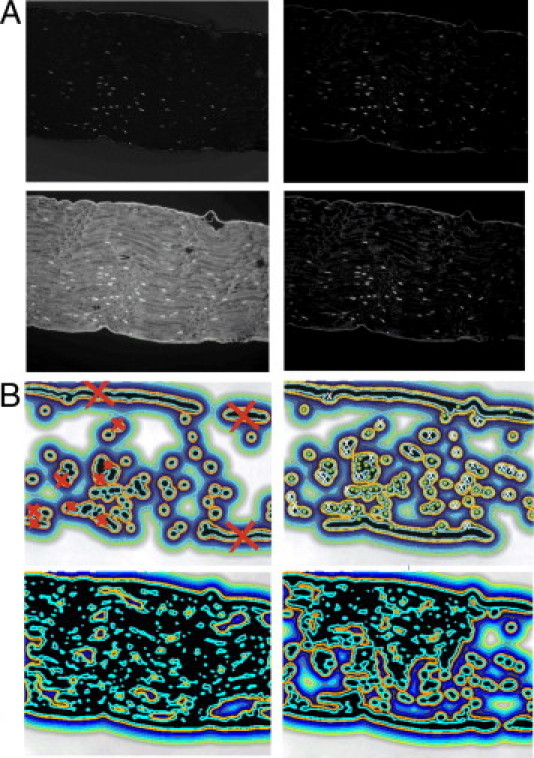
Segmented images of sciatic nerve fibers (A) with corresponding isolines of the estimated external energy of the VFC (B). Left: Second-order RVM2 and DCA algorithm. Right: Third-order RVM3 and NMU-ℓ1 algorithm. Isoline images in B are obtained from segmented images shown in A and are in one-to-one correspondence with them. On the isoline images obtained from the RVM-transformed images, the false-positive and false-negative spots are marked by red or white crosses, respectively; spots that fall on tissue border were excluded from the accuracy analysis.