Fig. 7.
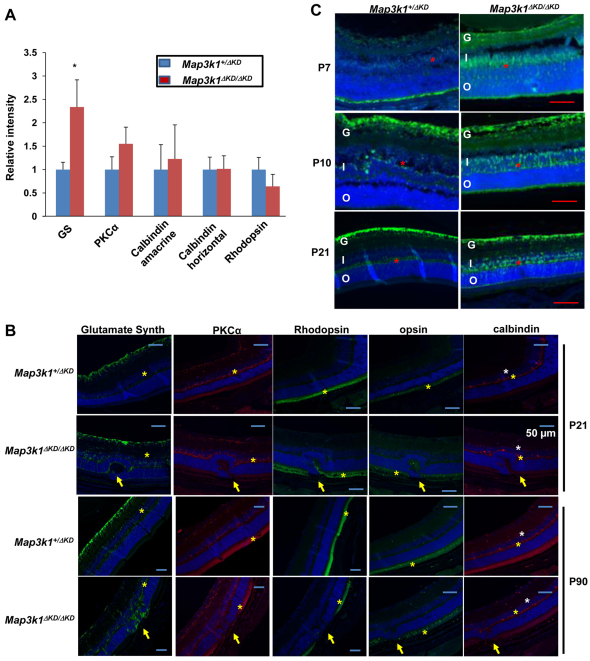
MAP3K1 inhibits Müller glial cell proliferation. (A,B) Eyes isolated from Map3k1+/ΔKD and Map3k1ΔKD/ΔKD mice were subjected to immunostaining using various antibodies as indicated. (A) Staining intensity was measured in P21 eyes. Results represent the average of at least four retinas of each genotype and statistical analyses were carried out by comparing the numbers in different genotypes. Data are mean+s.e.m. *P<0.05. (B) Pictures of anti-glutamine synthetase (green; Müller cells), anti-PKCα (red; bipolar cells), anti-calbindin [red; horizontal cells (yellow asterisks) and amacrine (white asterisks)], anti-rhodopsin (green; rods) and anti-opsin (green; cone) staining taken under fluorescent microscopy. Nuclei were stained by DAPI (blue). Positive stained cell layers are marked by asterisks and abnormal retina folding in the knockout mice is indicated with arrows. Scale bars: 50 μm. (C) Photographs of immunostaining by anti-glutamine synthetase of retinas at different postnatal ages. Positive stained cell layers are marked by red asterisks. G, ganglion layer; I, inner nuclear layer; O, outer nuclear layer. Scale bars: 100 μm.

