Fig. 4.
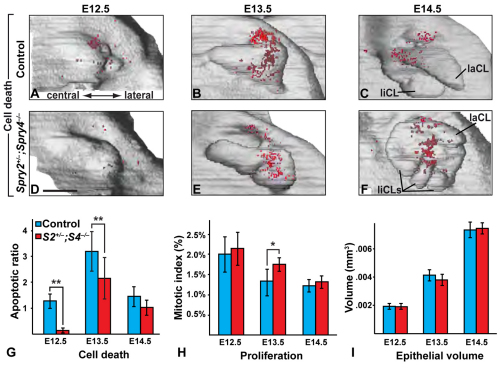
Cell death and proliferation in incisors of control and Spry2+/–;Spry4–/– embryos. (A-F) Three-dimensional reconstructions viewed from mesenchymal aspect and location of apoptotic elements (red dots) in epithelia of control (A-C) and Spry2+/–;Spry4–/– embryos (D-F) at E12.5 (A,D), E13.5 (B,E) and E14.5 (C,F). Scale bar: 100 μm. (G-I) Apoptotic rate (G), mitotic index (H) and epithelial volume (I) in control and Spry2+/–;Spry4–/– embryos. Mean±s.e.m. are plotted. *P<0.05, **P<0.01.

