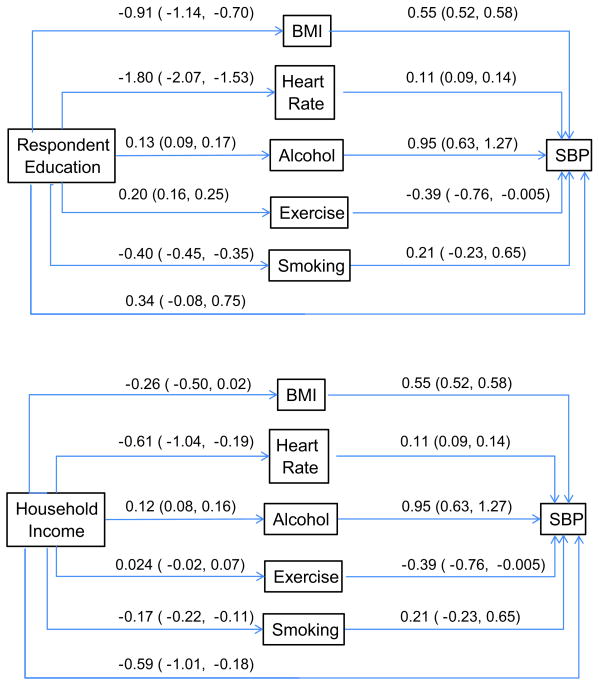
Figure 2.
Results of path model estimating indirect effects from education and income to SBP by way of biobehavioral variables. Values are unstandardized path weights with 95% confidence limits. Weights can be interpreted in original metric of the variable. Linearity was assumed for all associations. Results were estimated simultaneously from the same model, but separated here for presentational clarity.

