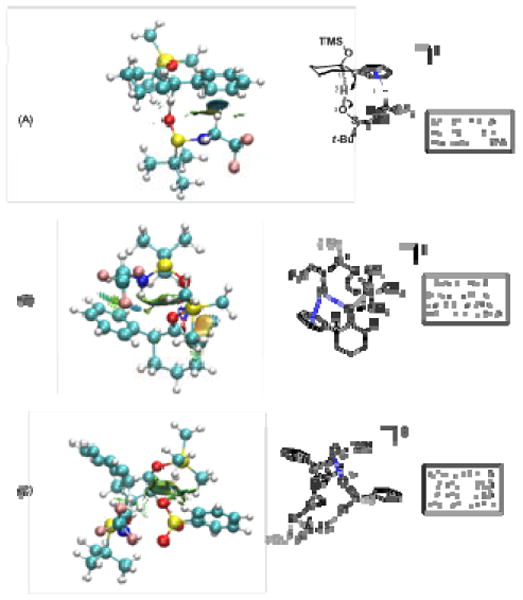
Figure 2.

NCI (noncovalent interaction) analysis of calculated transition states. Gradient isosurfaces for noncovalent interactions are diplayed. The surfaces are colored according to the strength of the NCI which increase from green to blue with red signifying destabilizing nonbonded overlap. (A) proton transfer from sulfinamide to substrate; (B) silyl transfer from substrate to sulfinamide; (C) proton transfer with a sulfonate counterion included. Structures fully optimized at the M05-2X/6-31+g(d,p) level of theory.
