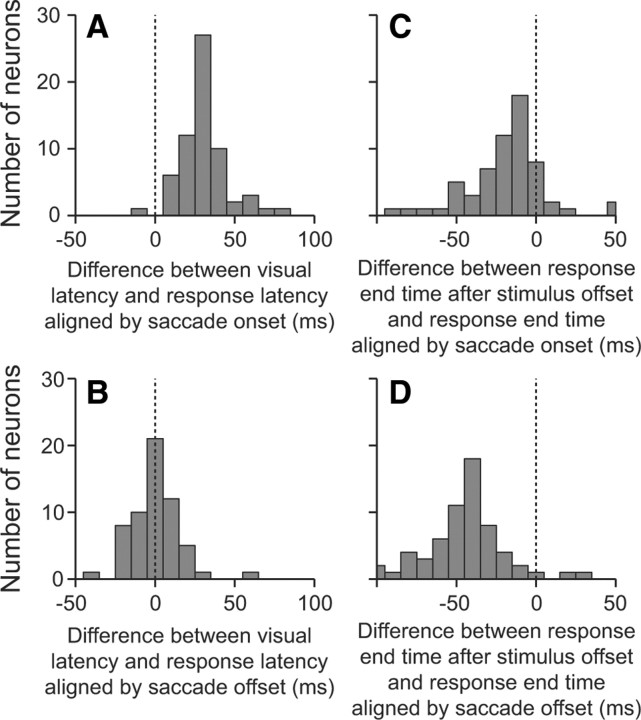
Figure 4.
Distributions of response latencies as a function of stimulus onset and saccadic onset or saccadic offset. A, B, Histograms showing the difference in response latencies between the visual latency and the latency of the response aligned by saccade onset (A) or offset (B). C, D, Histograms showing the difference in the response-end time between the end of the response caused by the stimulus being extinguished and the end of the response caused by the stimulus being removed from the receptive field by a saccade, aligned by saccade onset (C) or saccade offset (D).

