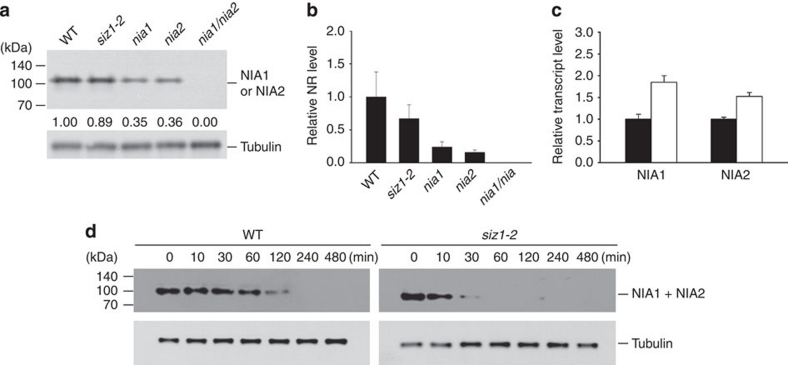
Figure 5. Effect of AtSIZ1 on NR levels.
(a, b) Total proteins were extracted from the leaves of WT, siz1-2, nia1, nia2 and nia1/nia2 plants. The NIA1 or NIA2 proteins were detected by immunoblotting with a cucumber anti-NR antibody. Tubulin levels were used as loading controls. Experiments were carried out four times, and one of the immunoblotting results is shown (a). Numbers under lanes indicate relative intensities. Mean values of the intensities were calculated and used to draw the graph (b). Results are shown as means±s.e. (n=4). (c) Total RNA was isolated from cycloheximide-treated WT and siz1-2 plants. Transcript levels of NIA1 and NIA2 were examined by real-time RT–PCR with gene-specific primers. Black and white bars indicate WT and siz1-2, respectively. (d) Total proteins were extracted from cycloheximide-treated WT and siz1-2 plants for the indicated time. The NRs were detected by immunoblotting with the cucumber anti-NR antibody. Tubulin levels were used as loading controls.

