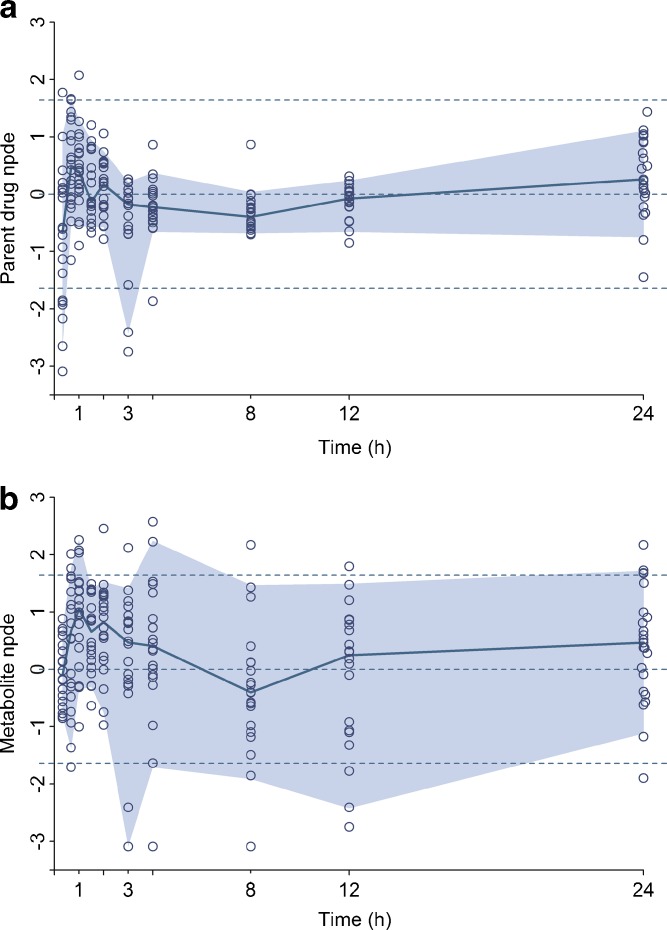
Fig. 7.
Normalized prediction distribution errors versus time from the final covariate model using the external evaluation dataset for the parent drug (a) and the metabolite (b). The corresponding 90% interval and the median are overlaid on the plot, and the dashed lines represent the 90% interval and median of the normal distribution

