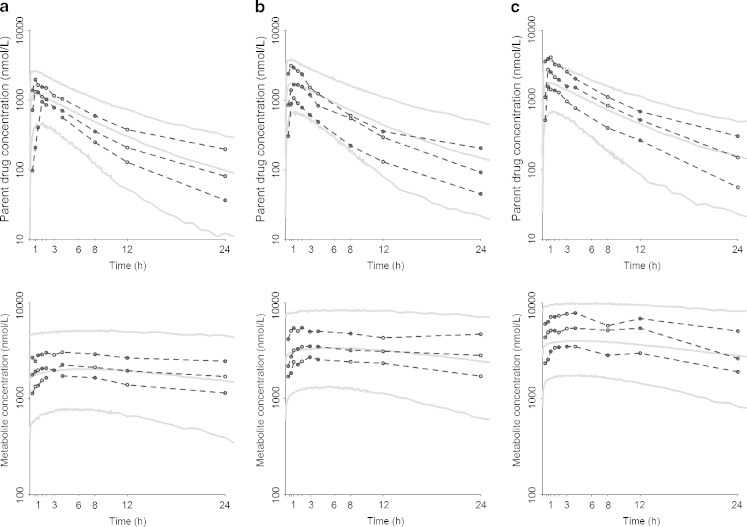
Fig. 8.
Classic visual predictive check plots of the final covariate model using the external evaluation dataset for the parent drug (top) and the metabolite (bottom) on a semi-log scale. The plain lines in grey represent the 5th, 50th, and 95th predicted percentiles and the dark dots jointed by dashed lines represent the 5th, 50th, and 95th observed percentiles for the parent drug (top) and the metabolite (bottom) for a dose of a 10, b 20, and c 30 mg

