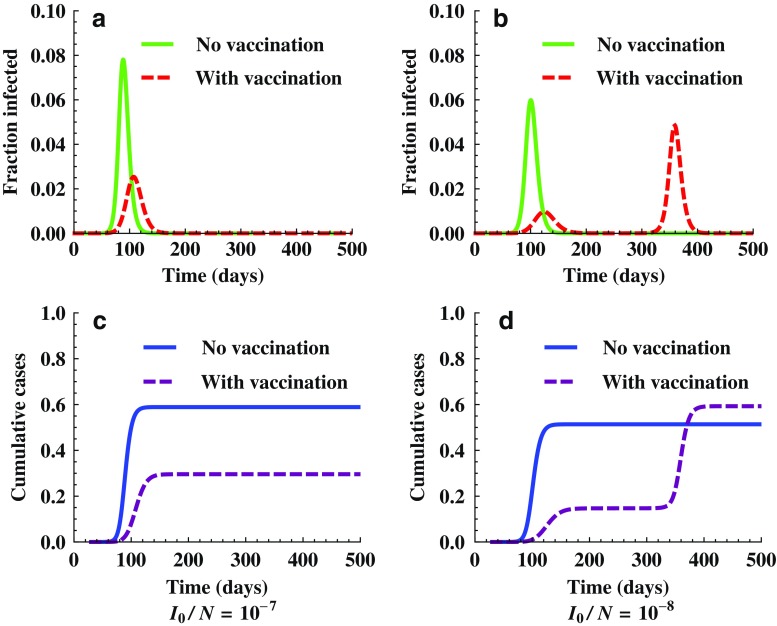
Fig. 11.
Simulations showing the effect of initial conditions. It demonstrates changes in epidemic outcomes for two different values of initial fraction of infected individuals, I 0 /N = 107 (a and c) and I 0 /N = 108 (b and d). The model used is (2.5) with f 0 = 0, p 0 = 0.1, t 0 = 30, and t v = 0. We observe that for the case of I 0 /N = 108, a second wave occurred around t = 350 and the final cumulative infections with vaccination is higher than that without vaccination

