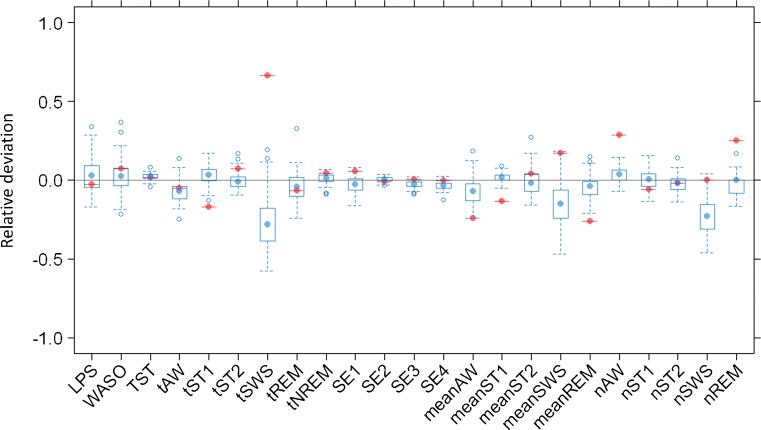
Fig. 6.
Results from posterior predictive check on dataset B: median aggregated parameters computed on dataset B are compared with the corresponding median aggregated parameters computed on 100 datasets simulated from parameter values estimated on dataset B. Comparison is shown in terms of relative deviation. Represented parameters are described in Fig. 3 legend. Red dots are depicted for visualizing the relative deviation of median values computed from study A, from median values computed from study B

