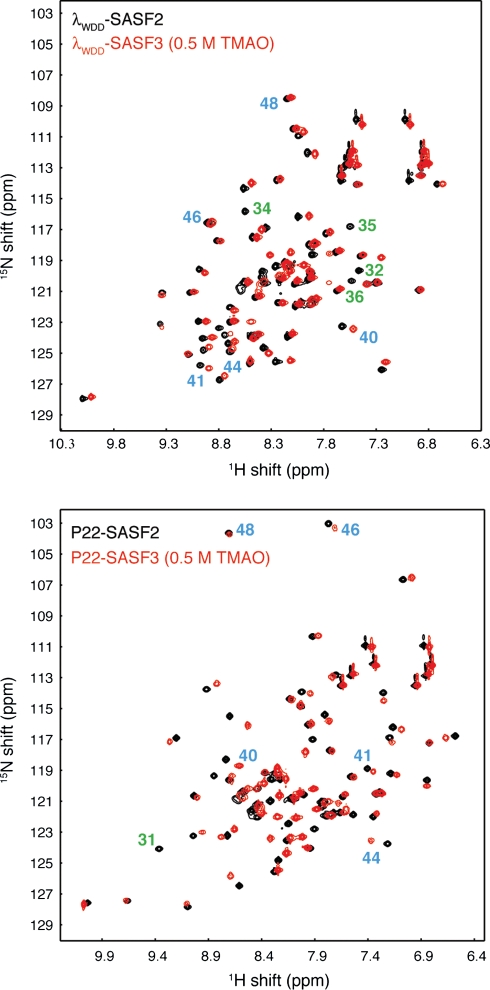
Fig. 5.
Comparison of 15N-1H correlation spectra for SASF2 (black) and SASF3 (red) chameleon sequences in λWDD host background (top) and P22 host background (bottom). SASF3 samples include 0.5 M TMAO to enhance protein stability, and all spectra were obtained at 288 K. Blue numbers denote key residues in the structurally divergent C-terminal region containing the chameleon sequence: the small movements in chemical shift indicate retention of a common C-terminal structure between SASF2 and SASF3. Green numbers indicate selected residues assigned in SASF2 constructs that are at or near the site of specific sequence differences between SASF2 and SASF3. Such residues would be expected to show large chemical shift differences even when structure is retained, and indeed the resonances for these amide groups lack obvious corresponding resonances in SASF3.

