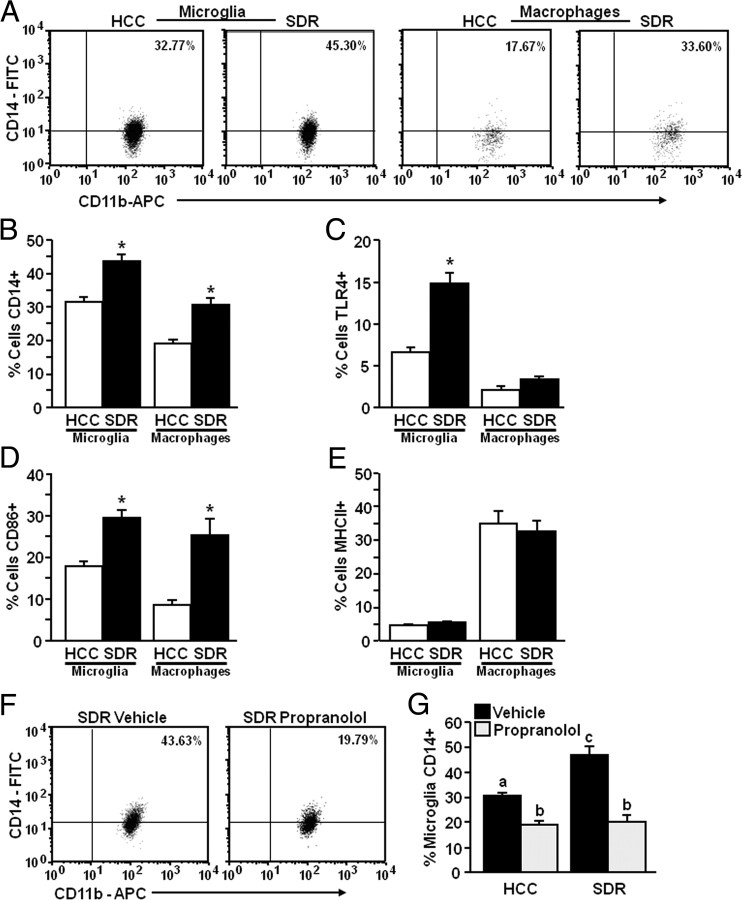
Figure 4.
Increased surface expression of inflammatory markers on microglia and CNS macrophages after repeated social defeat. Male C57BL/6 mice were subjected to six cycles of SDR. Brains were collected 14 h after the sixth cycle of social defeat, CD11b+ cells were enriched by Percoll gradient separation, and CD11b, CD45, CD14, TLR4, and CD86 expression levels were determined. Cells were gated on microglia (CD45low) or macrophages (CD45high). A, Representative bivariate dot plots are shown for CD11b/CD14. B–E, Average percentages of positive cells for CD14 (B), TLR4 (C), CD86 (D), and MHC-II (E) are shown. Bars represent the mean ± SEM (n = 9). Asterisks indicate HCC and SDR within cell types are significantly different (p < 0.05) from each other. In a separate but related study, male C57BL/6 mice were injected subcutaneously with vehicle or propranolol (10 mg/kg) before each of the six cycles of social defeat. Brains were collected 14 h after the sixth cycle of social defeat and CD11b, CD45, and CD14 levels were determine as above. F, G, Representative bivariate dot plots and the average percentage of positive cells for CD14. Bars represent the mean ± SEM (n = 10–12). Means with different letters (a, b, or c) are significantly different (p < 0.05) from each other. APC, Allophycocyanin; FITC, fluorescein isothiocyanate.

