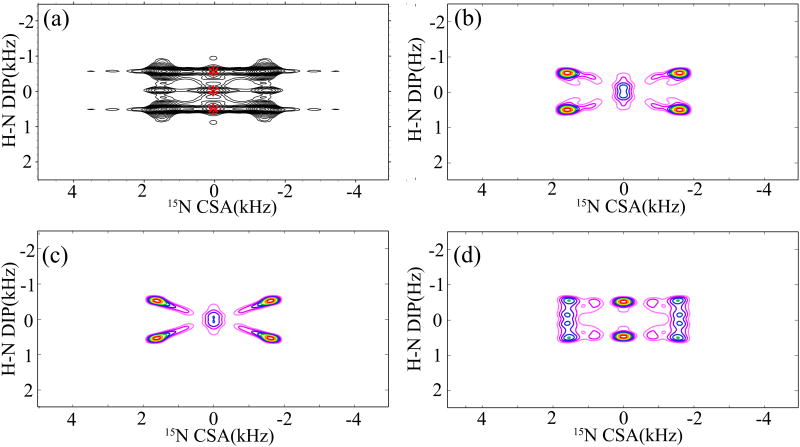
Figure 8.
(a) 2D 15N CSA/1H-15N DIP correlation spectrum of N-acetyl-valine (NAV), extracted from the 3D R1817/R1423 experiment along the 15N isotropic chemical shift. The spectrum was recorded with 64 scans, 16 t1 and 32 t2 increments. The sample was spun at a MAS frequency of 10 kHz. (b) Best-fit simulated correlation spectrum, obtained with βNH(δzz) = 25°±5° and αNH(δxx) = 20°±5°, and the same acquisition and processing parameters as in the NMR experiment. (c) Simulated correlation spectrum with βNH(δzz) = 0° and αNH(δxx) = 0°. (d) Simulated correlation spectrum with βNH(δzz) = 90° and αNH(δxx) = 0°.

